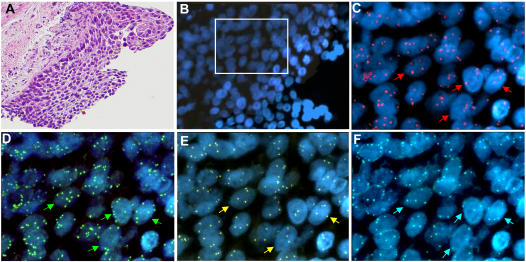
Figure 1.
Bronchial epithelium area selected for fluorescence fluorescence in situ hybridization (FISH) analysis. (A) Area with carcinoma in situ stained by hematoxylin and eosin. Magnification: ×20. (B) The same area in the sequential slide submitted to the LAVysion FISH assay stained by 4′,6-diamidino-2-phenylindole (DAPI). Magnification: ×40. The area included in the open rectangle is shown at 100× magnification for combination of fluors in (C) DAPI and SpectrumRed, (D) DAPI and SpectrumGreen, (E) DAPI and SpectrumGold, and (F) DAPI and SpectrumAqua. The specimen displayed aneusomy for (C) epidermal growth factor receptor, (D) 5p15.2, (E) v-myc myelocytomatosis viral oncogene homolog (MYC), and (F) Chromosome Enumeration Probe 6 (CEP6) regions. Arrows indicate single nuclei with extra copies of the tested target DNA.

