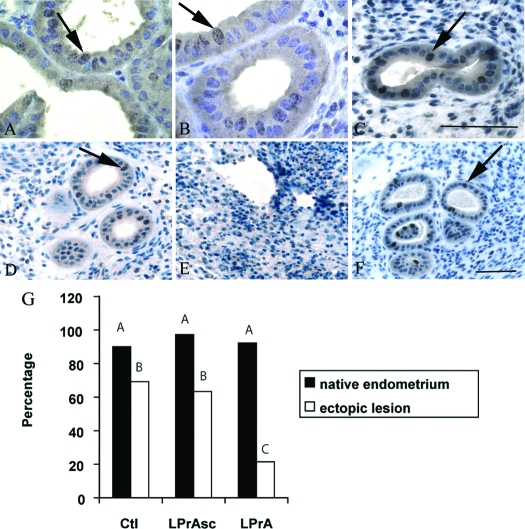
Figure 3.
Comparison of immunohistochemical PH3 expression in endometriosis-like lesions after 7-d LPrA treatment. Relative PH3 expression is demonstrated as seen in mitotic figures of native endometrium (60×) and endometriosis-like lesions (40×) within glandular epithelium (arrows). Similar PH3 expression was observed in the native endometrium of control (Ctl) (A), LPrA (B), and LPrASc- (C) treated animals. Minimal PH3 expression was observed in ectopic lesions after LPrA treatment (E) compared with lesions of control (D) and LPrASc (F) treatment animals. PH3 expression after LPrA treatment with quantification of the total percentage of epithelial glands with PH3 staining. G, Ten random HPFs per replicate were selected. The proportion of total glands staining for PH3 was calculated (one mouse per replicate). Relative proportion of PH3 expression in native endometrium was similar in all groups. PH3 expression was markedly reduced in LPrA-treated mice compared with control and LPrASc mice. Different letters represent differences at the level of P < 0.01 (χ2). Scale bars, 100 μm.

