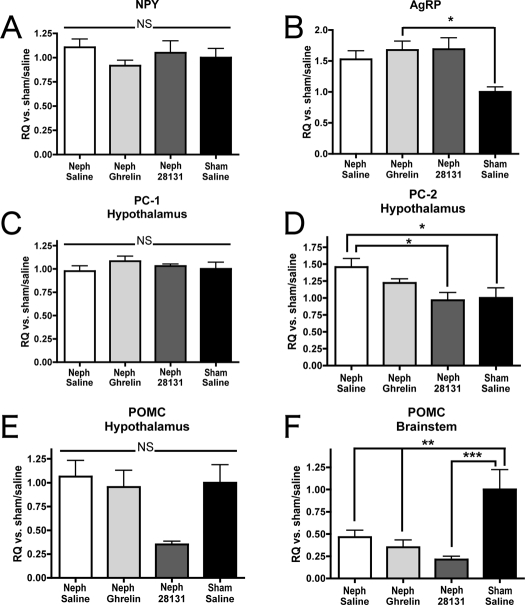
Figure 5.
Appetite-regulating neuropeptide gene expression. Change in expression of neuropeptide transcript as determined by real-time PCR. Data are reported as fold change vs. sham/saline rats for Neph rats treated with saline, ghrelin, or BIM-28131. Expression levels are shown in the hypothalamus for NPY (A), AgRP (B), PC-1 (C), PC-2 (D), and POMC (E) and in the brainstem for POMC (F). Significant differences are indicated: *, P < 0.05; **, P < 0.01; ***, P < 0.001.

