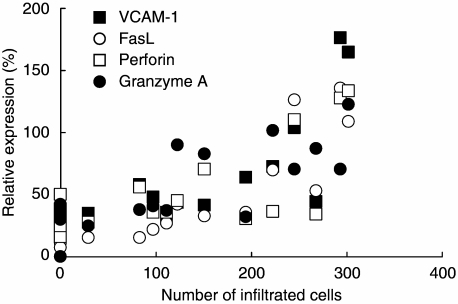
Fig. 5.
Correlation coefficients between the number of infiltrated mononuclear cells and the results of quantitative polymerase chain reaction (PCR). Correlation coefficients (R2) between the number of infiltrated mononuclear cells and the analysed gene mRNA levels were 0.59 [▪: vascular cell adhesion molecule-1 (VCAM-1)], 0.74 (○: FasL), 0.46 (□ perforin) and 0.59 (□: granzyme A).

