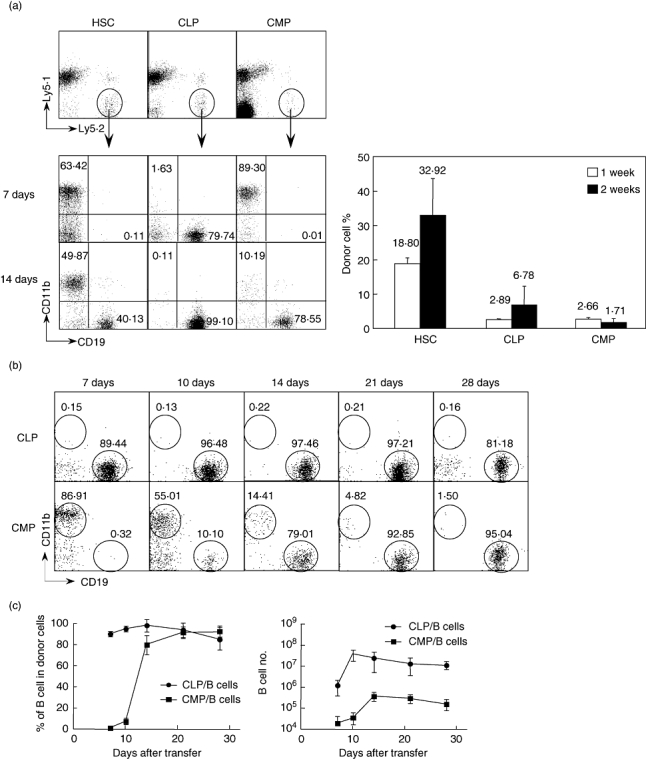
Fig. 1.

Comparison of the potential of B cell production from different progenitors. Freshly sorted haematopoietic stem cells (HSCs), common lymphoid progenitors (CLPs) and common myeloid progenitors (CMP) from B6 Ly5·2 mice were injected intravenously into B6 Ly5·1 congenic mice. At various times post-transplantation, recipient spleen cells were collected and stained with fluorescein isothiocyanate (FITC)-Ly5·2, PE-CD19, phycoerythrin (PE)-Cy5·5-Ly5·1 and allophycocyanin (APC)-CD11b. (a) Donor-type Ly5·2+Ly5·1– cells were analysed for CD19 and CD11b expression. The numbers in the figure indicate the percentage of each population in the donor-type cells (left figure). The right panel shows the percentage of donor-derived cells (Ly5·2+Ly5·1–) among total splenic low density (LD) cells. Each group included four mice. (b) CD19+ lymphoid and CD11b+ myeloid progeny from CLP and CMP at the indicated time-points. The numbers in the figure indicate the percentage of each population in the donor-type cells. (c) Percentages and cell numbers of B cells generated from CLPs and CMPs at various time-points after transfer. Each time point includes six to eight mice.
