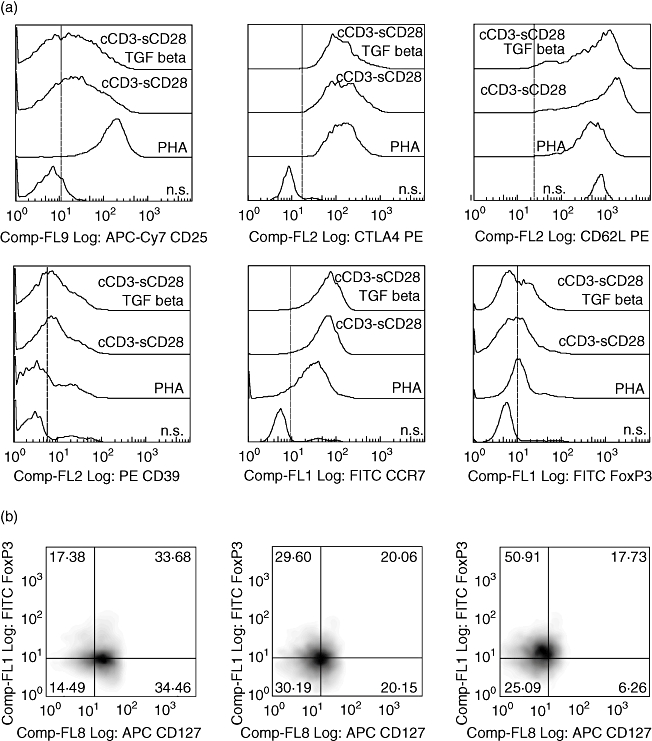
Fig. 1.

Evaluation of T regulatory (Treg) immunophenotype on T lymphocytes after 5 days of culture with different stimuli: (a) histograms of expression of CD25, cytotoxic T lymphocyte-associated protein antigen-4 (CTLA4), CD62 ligand (CD62L), CD39, chemokine (C-C motif) receptor 7 (CCR7) and forkhead box P3 (FoxP3); (b) percentage of FoxP3+ CD127− cells in a CD25 positive gate in the different groups. All dot plots were obtained after lymphocyte scatter and CD4+ gating.
