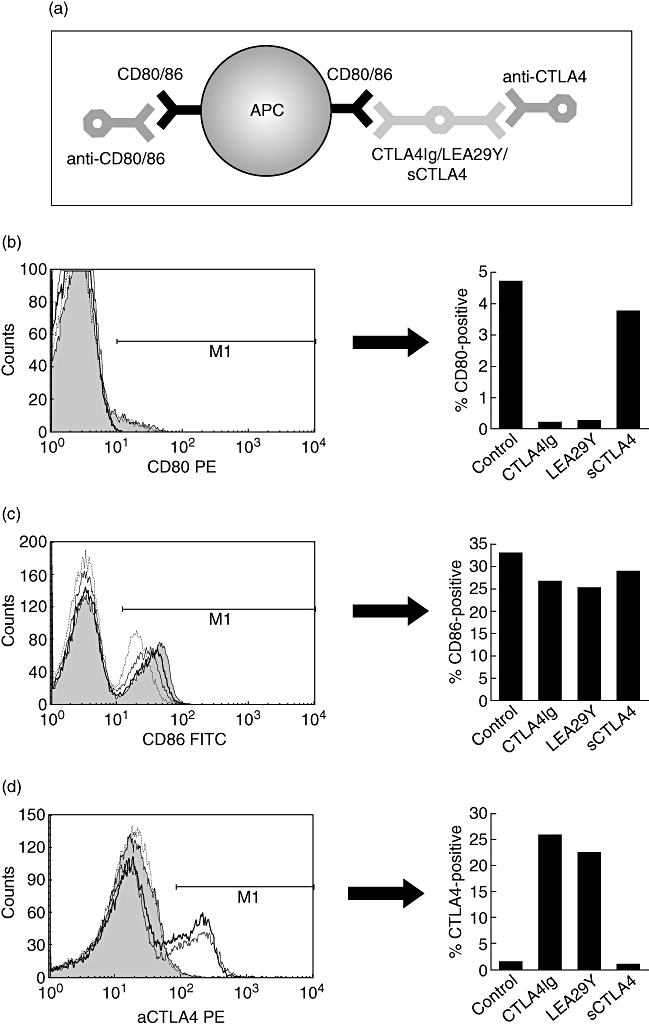
Fig. 1.

Schematic representation of cytotoxic T lymphocyte antigen 4 (CTLA4) binding and competition assay (a). Antigen-presenting cells (APCs) were incubated with CTLA4Ig, LEA29Y or sCTLA4. Subsequently, the cells were incubated with antibodies to CD3, CTLA4 (bound to the APC) and to its ligands CD80 and CD86 and expression was measured by fluorescence-activated cell sorter. Histograms show a representative example (of three independent experiments) of the expression of CD80 (b), CD86 (c) and CTLA4 (d) on APCs (CD3-negative peripheral blood mononuclear cells). Untreated APCs are represented by the grey area, APCs incubated with CTLA4Ig by the thick line, with LEA29Y by the thin line and with sCTLA4 by the dotted line. The bar graphs on the right represent the expression of the respective markers.
