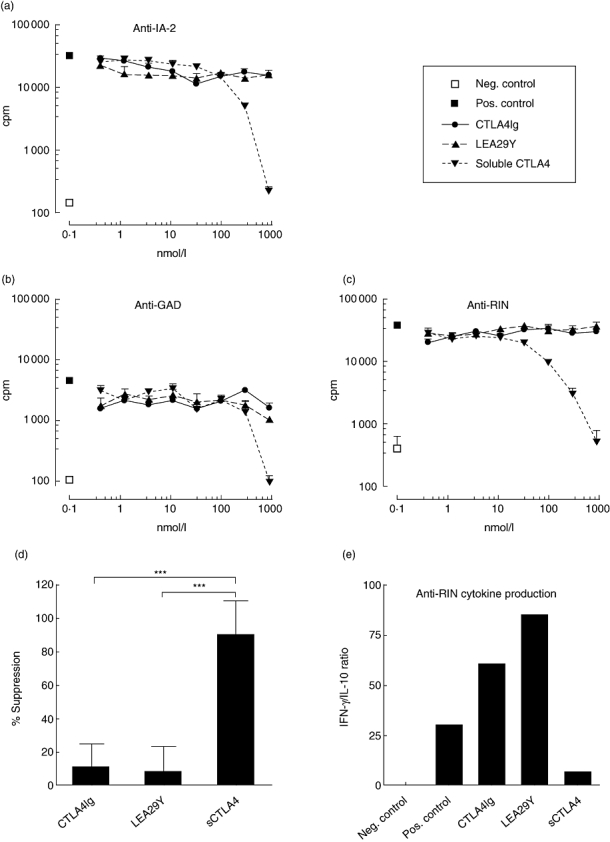
Fig. 2.

Proliferation of autoreactive T cell line specific for IA-2 (a) and T cell clones specific for glutamic acid decarboxylase (b) and rat insulinoma (RIN) (c). The x-axis indicates the added concentration of protein, the y-axis indicates proliferation in counts per minute (cpm). □ = without peptide (negative control), ▪ = with peptide (positive control), • = cytotoxic T lymphocyte antigen 4 (CTLA4)Ig, ▴ = LEA29Y, ▾ = soluble CTLA4. Shown are mean ± standard error. All data were reproduced once. (d) Average suppression of the highest concentration per protein in all six experiments performed. (e) Cytokine production (interferon-γ/interleukin-10 ratio) of the anti-RIN clone treated with the highest concentrations. ***P-value < 0·001.
