Figure 4.
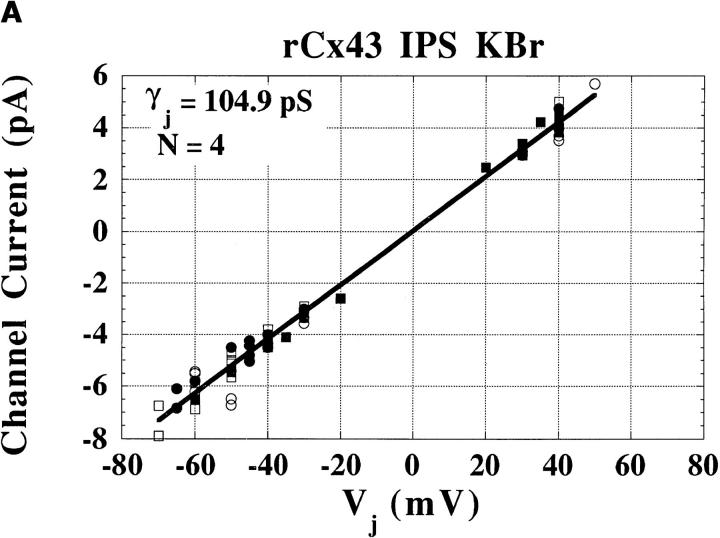
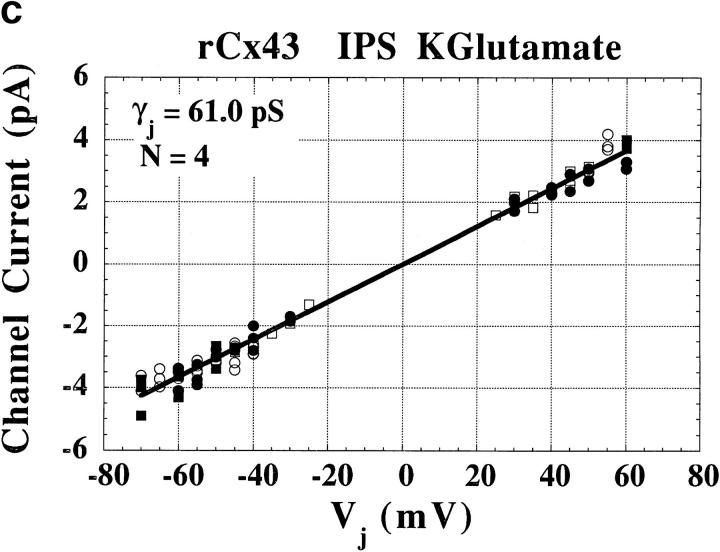
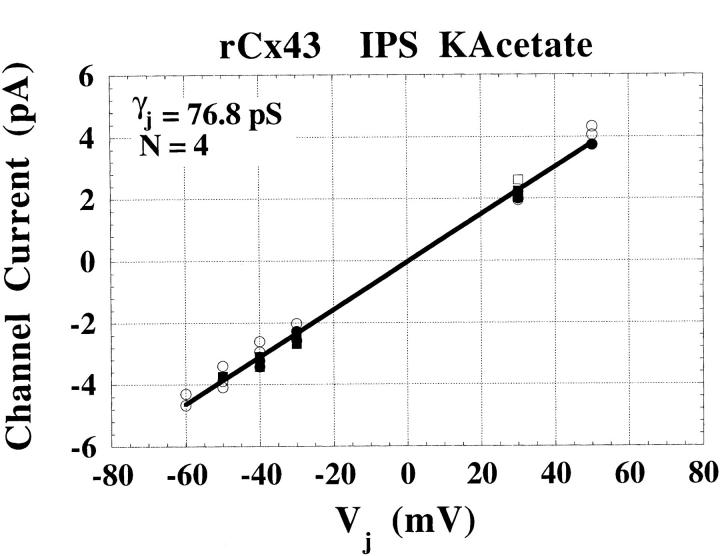
Anionic single channel junctional current-voltage relationships. (A) Linear regression fit (solid line) of the single channel current amplitudes obtained at the respective transjunctional voltage in 115 mM KBr. Each symbol type refers to a different experiment (n = 4) and every current amplitude was obtained using the same procedures illustrated for the cations examined above. The slope conductance is 104.9 pS. (B) The single channel current-voltage relationship for four cell pairs in 115 mM Kacetate with a slope of 76.8 pS. (C) The single channel current-voltage relationship for four cell pairs in 115 mM Kglutamate with a slope of 61.0 pS. The slope conductances illustrated here are not statistically different from the mean γj calculated from the individual single channel junctional current-voltage relationships for each cation (see results). Correlation coefficients were >0.99 for all graphs.


