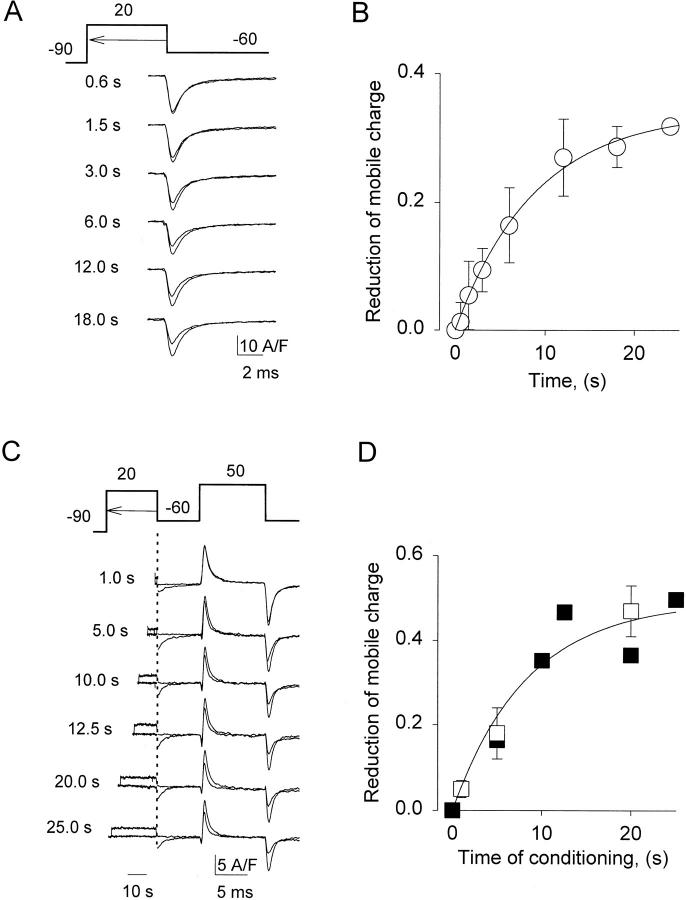
Figure 2.
Reduction of mobile charge takes seconds. (A) OFF gating current transients after increasing times at +20 mV. The records are asymmetric currents obtained as described in methods. Durations of the test depolarizations that preceded the transients are listed near each plot. Test OFF transients are shown superimposed with larger reference transients, obtained at the trailing edge of 0.045-s pulses applied before each test depolarization. (B) Difference between reference and test OFF charge transfer, normalized to reference, vs. duration of depolarization at +20 mV (n = 9). The continuous line represents ΔQ max(1 − exp(−t/τ)), with ΔQ max = 0.34 and τ = 8.7 s. (C) Gating currents elicited by a fixed test pulse after conditioning depolarizations of different durations (listed near each record). At left in the panel are the asymmetric currents during the conditioning depolarization, recorded at a slower sampling rate (up to the time indicated by the dotted line). Records obtained with and without conditioning pulse are shown superimposed. (D) Difference in ON charge transfer, reference minus conditioned, normalized to reference, vs. duration of the conditioning depolarization (open symbols, averages; n = 4; filled symbols, data from records in C). Continuous line generated as in B, with ΔQ max = 0.49 and τ = 8.5 s.

