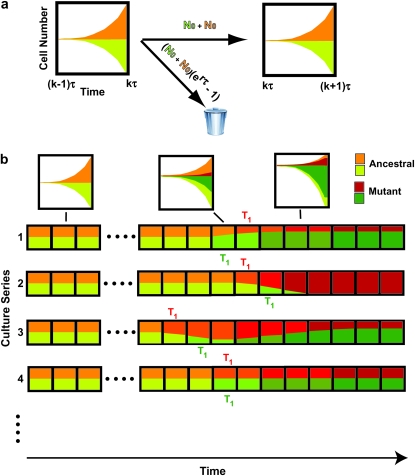
Figure 1.—
Schematic of the YFP/CFP coculture experiment. (a) The exponential expansion of the YFP and CFP populations (distinguished by green and red colors) during the growth periods before and after the kth bottleneck at a time early in the experiment when mutant cells are present at low abundance. The cultures begin with N0 of each type of cell and exponentially expand for time τ so that there are N0erτ of each. At the bottleneck N0 of each type of cell is removed and transferred to the next culture. The remainder is discarded. In the actual experiment, τ = 11.7 doublings, and the expansion factor is erτ ∼ 3300. (b) Four representative time courses for the behavior of the color ratios. Ancestral cells are indicated by light colors and mutants (of any selection coefficient) by dark colors. The colors are drawn separately for illustrative purposes, but in the actual system the cells are uniformly mixed. Schematic growth curves for the mutant and ancestral populations during three of the growth periods for the first series of cultures are shown in boxes above that series. The behavior of each culture series is described in the text. The red and green T1's indicate the times when mutant and ancestral cells are of equal abundance in the respective populations.

