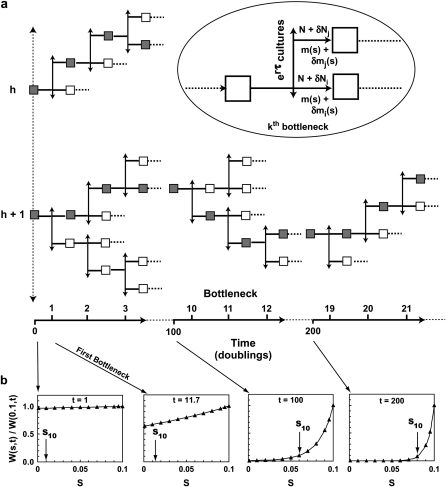
Figure 2.—
The conceptual experiment. (a) An arbitrarily large number of initial cultures, each containing N0 cells, are started at t = 0. Two such cultures, h and h + 1, are shown. After time τ, the time of the first bottleneck, the cells in each initial culture are divided among erτ daughter cultures so that each receives N0 cells. Thus no cells are discarded. After each subsequent time interval τ, each daughter seeds erτ next-generation daughters. During each growth phase mutants received from the previous culture expand and de novo mutants randomly occur. At each bottleneck there is statistical variation in the number of mutant and ancestral cells received by the daughters. This process is indicated by the inset in the oval where m(s) and δm(s) indicate the average number and the fluctuation from the average of the mutants transmitted to the next daughter, and N and δN indicate the same for the ancestral cells. The time (in population doublings) and the number of the bottleneck is indicated along the bottom, assuming 11.7 doublings between bottlenecks. (b) The shape of W(s, t), normalized to its value at s = 0.1, is shown as a function of s for representative values of t. As t increases the weight of this function rapidly moves to larger s. The distribution of mutant cells in the pooled culture of a is given by ρ(s)W(s, t). For each of the possible paths through a series of daughters, the selection coefficients of the mutants will differ due to the stochastic variation, but the powerful shape of W(s, t) ensures that those that become prominent will be confined to a small range of s almost regardless of the shape of ρ(s). If ρ(s) is a constant out to some smax, then W(s, t) directly gives the expected distribution of the mutants. The values of s, termed s10, above which 90% of the mutant cells occur are indicated on the graphs for this case (see Equation 8).

