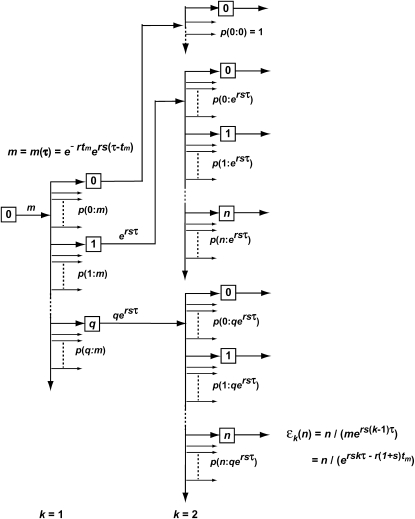
Figure 4.—
Schematic of the stochastic transmission of the progeny of a single mutation through two bottlenecks. The boxes indicate individual cultures that are related to each other according to the exhaustive sampling scheme described in Figure 2a. A mutation is assumed to occur at some time during the initial culture period and on average m mutant progeny are passed to each of its erτ daughters. The daughters are arranged in order of the number of mutant cells they receive, which is indicated within the boxes. The small arrows indicate the additional daughter cultures that received the same number of mutant cells. The proportion of the first-generation daughters receiving an actual number, q, is given by a suitable probability distribution such as Poisson. Between the first and the second bottlenecks these mutants expand relative to the ancestral cells by a factor ersτ. These will again be probabilistically distributed to their daughters. From the second bottleneck onward, daughters with a particular number of cells, n, descend from multiple predecessor cultures. The probability of having n mutants after bottleneck k,  , is given by summing over these possibilities, as shown in Equation 13. The ratio of the actual number of mutant cells in an individual culture after the kth bottleneck to the average number for that time is ɛk (Equation 14).

