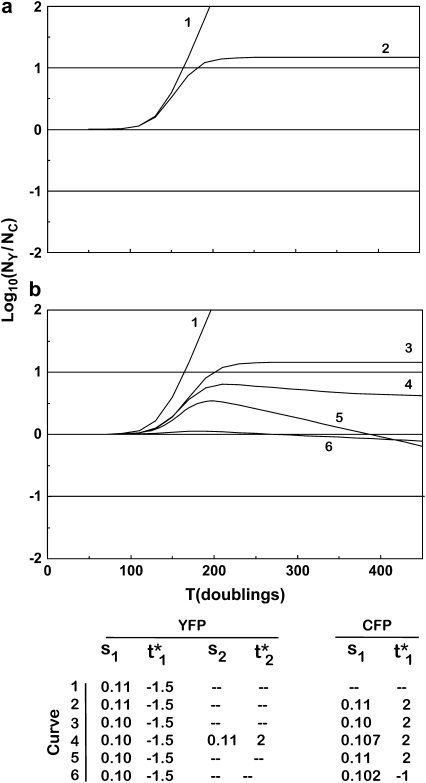
Figure 6.—
Characteristic behavior of Log10(NY/NC)as a function of time. (a) If all mutants have the same selection coefficient, ρ(s) equals a delta function, and two basic behaviors are possible for Log10(NY/NC). The ratio either departs from 0 and continues to increase (or decrease) until one population displaces the other (curve 1) or stabilizes at a constant value when mutants come to dominate both populations (curve 2). The effective mutation times  and the selection coefficients for the mutant clones for both a and b are shown at the bottom. (b) If the distribution of selection coefficients has finite width, then the behavior is more complex. The curves show the behavior of Equation 22 with either one or two (curve 4 only) mutant clones dominating
  for each population. In curve 1, a mutant occurs first in the YFP population, and it completely dominates the culture. Curve 3 shows the behavior if mutants with the same selection coefficient occur in both populations but at different effective times. This is unlikely to be stable as time progresses unless both selection coefficients are at the maximum available value, since a clone with higher s will eventually become dominant. Curve 4 shows two significant mutant clones in the YFP population with slightly different values of s and effective mutation times and a single significant clone in the CFP population with a value of s between those in the YFP mutants. In the YFP population the mutant with larger s must occur at a later effective time or the lower-s mutant would never affect the behavior of the culture. Note that the curve departs from 0 in the positive direction and bends over to develop a negative slope, which slowly become less negative as the larger-s clone become more dominant in the YFP population. Curve 5 shows the behavior with single prominent mutant clones in both populations. Finally, curve 6 shows the effect of single mutants in each population with nearly identical selection coefficients and effective mutation times. The curve hardly departs from 0.

