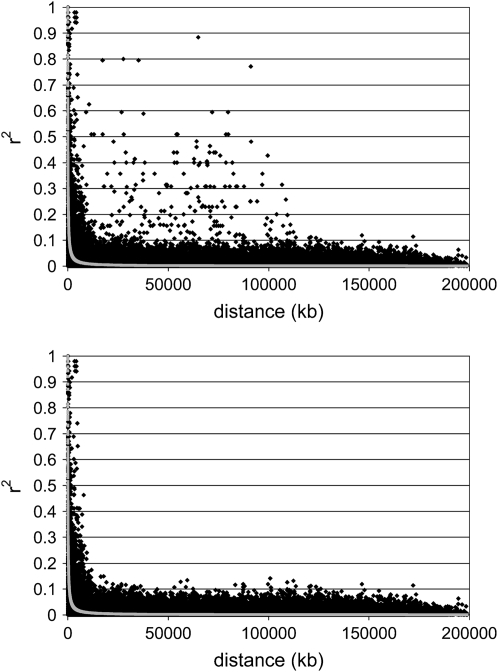
Figure 4.—
Decline of linkage disequilibrium (LD) measured by r2 against distance in kilobases. Data are for chromosome 1 and line 2, before (left) and after (right) elimination of the two markers most involved in high long-distance LD. Chromosome 4 had a similar pattern of decline but lacked high long-range LD. The graphs combine two different aspects of LD vs. distance: a scatterplot of estimates of r2 for pairs of SNPs (solid symbols) and a predicted LD value plot (shaded symbols) based on fitting the equation E(r2) = 1/(1 + 4 × Ne × d), where Ne is the effective population size and d is the distance in morgans (assuming 2.8 cM/Mb). We ignored the sample size correction of +1/n, where n is the number of haplotypes, as it is negligible due to large sample size.

