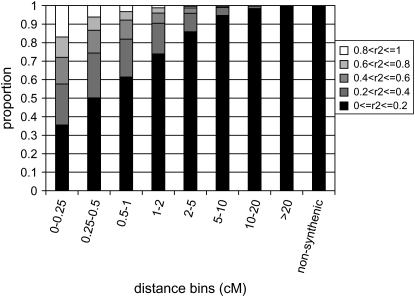
Figure 5.—
Frequency distribution of estimates of LD by r2 for syntenic and nonsyntenic marker pairs. The syntenic distribution was computed across chromosomes and lines, within between-marker distance bins. The nonsyntenic distribution was computed across lines. Similar distributions were obtained within lines and chromosomes. Distances, in centimorgans, are computed from the base pair distance by multiplying with the average centimorgan per base pair distance across the chicken genome.

