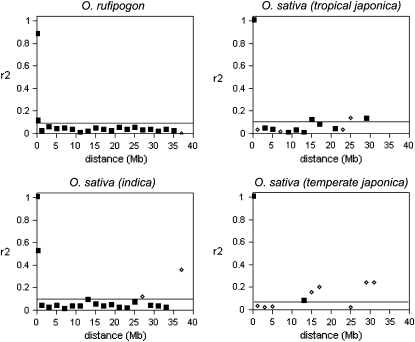
Figure 5.—
The relationship of median r2 vs. distance for genomewide SNPs using the STS data set. Symbols represent binned data in 2-Mb intervals, with the first three bins being <1 kb, 1–500 kb, and 0.5–2.0 Mb. Solid squares have at least 10 SNP pairs and open diamonds have <10 SNP pairs in the distance interval. A horizontal line indicates the 75th percentile from the distribution of unlinked SNPs from the STS data set (Figure 4).

