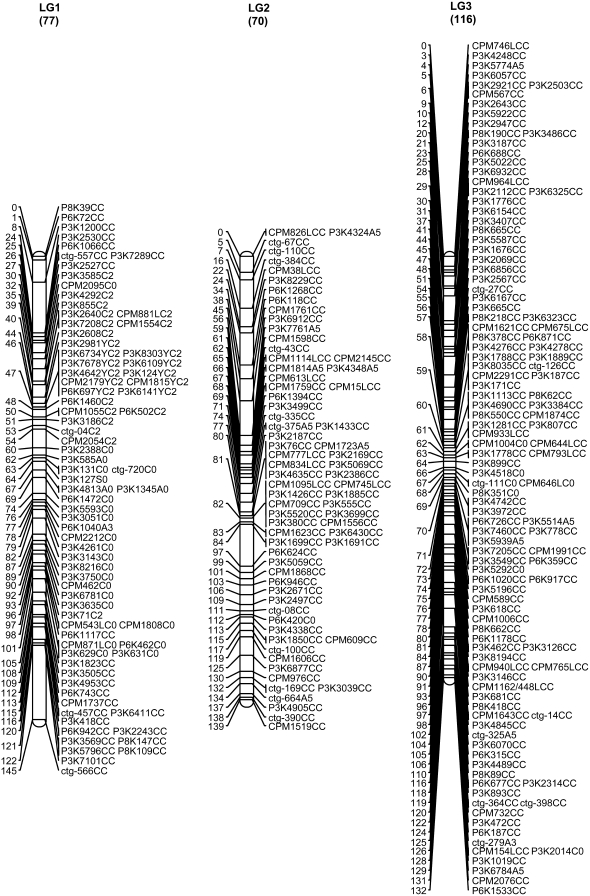
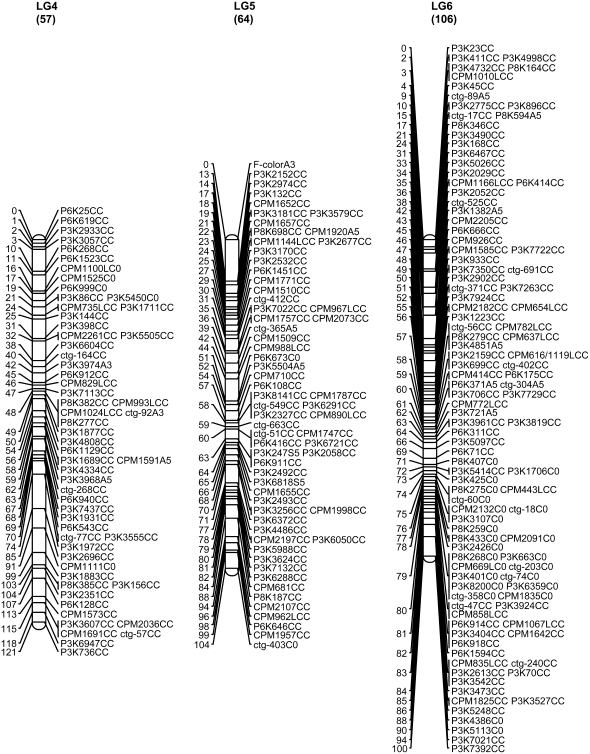
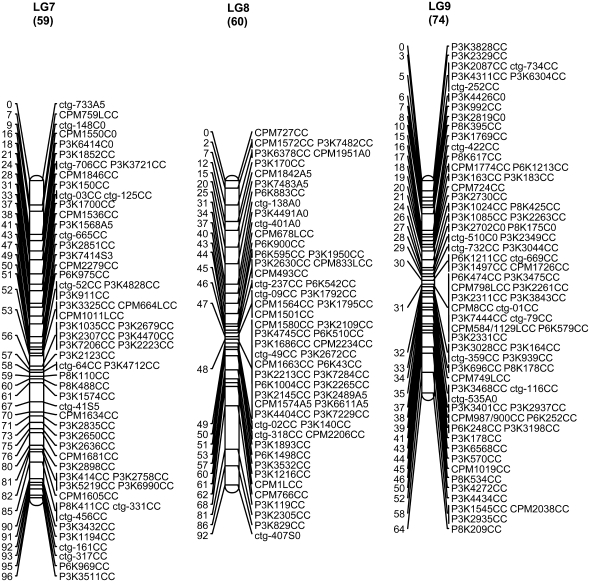
Figure 1.—
SSR genetic map of papaya linkage groups 1–12. The numerical scale at the left of the map is the cumulative length of the LG in centimorgans. The alphanumeric codes at the right of the map describe the SSR markers. The first three positions of the code represent the source or origin of the SSRs (see materials and methods: P markers from WGS, ctg markers from contig sequences, and CPM markers from BES sequences). The next-to-last element is the letter indicating the parent from which the marker was derived (A, AU9; S, SunUp; C, codominant); the last element of the code is information about the χ2 test (C, codominant fitting a ratio of 1:2:1; 0, not fitting any expected segregation ratio; 2, sex-linked codominant fitting a 2:1 ratio; 3, dominant fitting a 3:1; 5, dominant fitting both 2:1 and 3:1). Eleven SSRs on LG 1 with Y at the third position from the end indicate that they are sex-cosegregating markers. SSRs with L also at the third position from the end indicate that the genotype data were generated by a Li-Cor DNA analyzer. The MSY was mapped on LG 1 and the fruit flesh color was mapped on LG 5.


