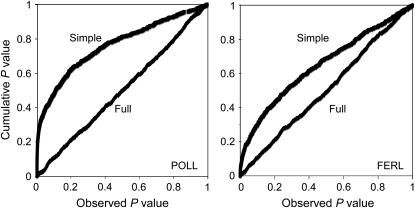
Figure 2.—
Plots of the cumulative distributions of P-values for the associations between our 706 random SNPs and days to pollen shed (POLL) and female ear length (FERL). The curved line within each plot represents the cumulative distribution of P-values under a simple model that does not incorporate population structure or recent coancestry. The diagonal line represents the cumulative distribution of P-values under the full model that includes 29 principal components that account for population structure and a kinship matrix that accounts for recent coancestry. The P-value distribution for the full model follows the expected distribution under the null hypothesis of independence between the SNPs and the traits.

