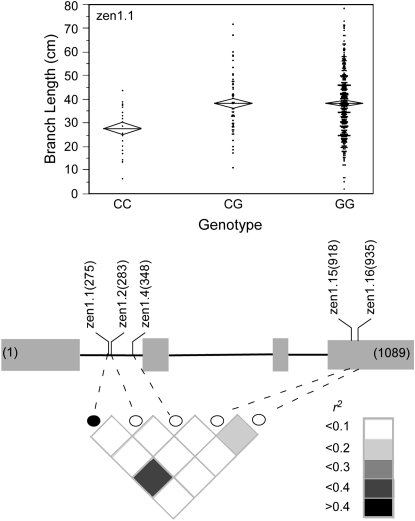
Figure 3.—
Schematic of zen1 showing the location in base pairs of the markers assayed and the degree of linkage disequilibrium between markers, as measured by r2. The marker that associates with branch length (BRLN) is represented by a solid circle. Shading indicates the magnitude of the linkage disequilibrium. The scatterplot shows the trait distribution for each genotypic class at marker zen1.1. The mean for each genotypic class is represented by a horizontal line. The diamonds depict the standard errors of the means.

