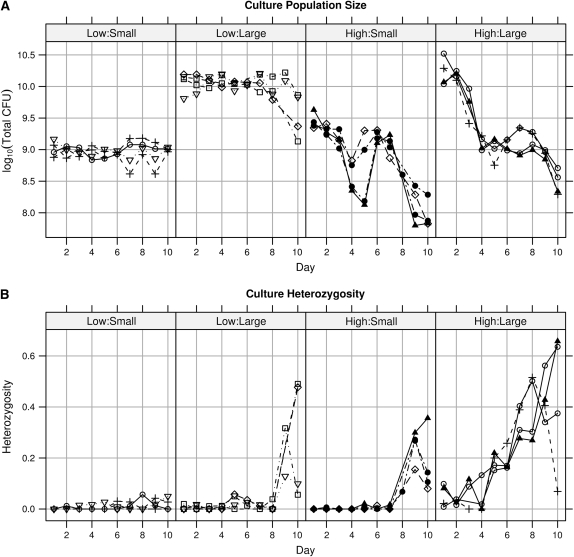
Figure 2.—
Time series of each replicate culture (line equals replicate) in the population size experiment. LB concentration (low,  ×; high, 1×) and relative flask size (small, large, see text) are shown at the top. (A) Maximum (day 1) population size (CFUs per tube) increases with both flask size and resource concentration. Relative flask size has a large and persistent effect on population size. (B) Heterozygosity tends to increase over time and does so more rapidly in larger flasks and in higher resource concentrations.

