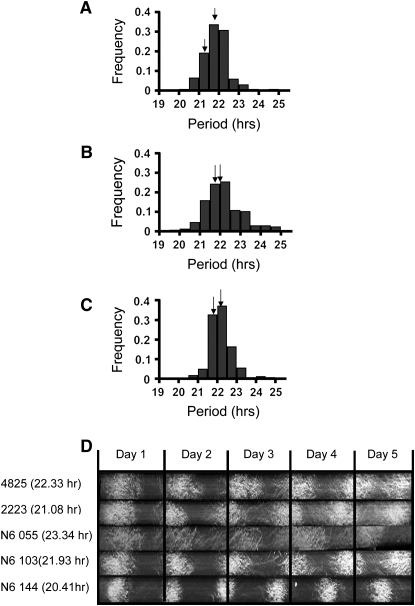
Figure 1.—
The circadian period variation in F1 populations. Phenotypic distributions of F1 progenies of N2 (A), N4 (B), and N6 (C) populations. The x-axis represents circadian period and the y-axis represents frequency of period in the corresponding F1 progenies. Arrows indicate the periods of the parents for each cross. (D) Race tube images of conidial banding patterns under constant darkness (free-running condition). Two N6 parents (FGSC 4825 and FGSC 2223) and three representative progeny (N6 055, N6 103, and N6 144) with different free-running periods are shown. The vertical black lines represent the growing front in a 24-hr period. The number in parentheses is the average period of the strain.

