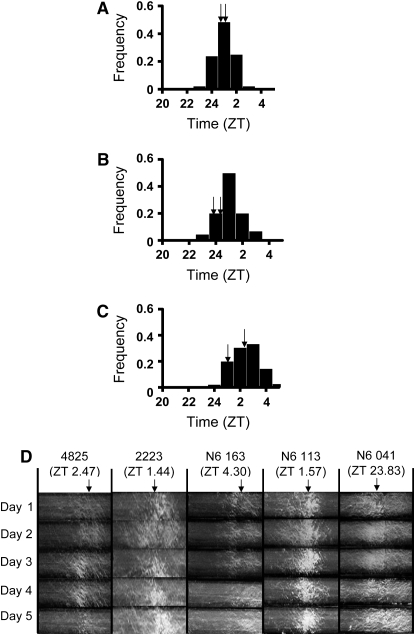
Figure 2.—
The entrained phase variation under 12:12 light/dark condition in F1 populations. The phenotypic distribution of F1 progeny of N2 (A), N4 (B), and N6 (C) populations are shown. The x-axis represents the entrained phase in ZT (see materials and methods) and the y-axis represents the frequency of the periods of the corresponding F1 progeny. ZT 24 is the same as ZT 0. ZT 0 is when light is on (dawn) and ZT 12 is when light is off (dusk). Arrows indicate the phases of the parents for each cross. (D). Race tube images of conidial banding pattern under 12:12 LD cycles for 5 days. N6 parents (FGSC 4825 and FGSC 2223) and three representative progeny (N6 163, N6 113, and N6 041) with different phases are shown. The number in parentheses is the average phase of the strain for 5 days. The arrow indicates the average phase value of each strain.

