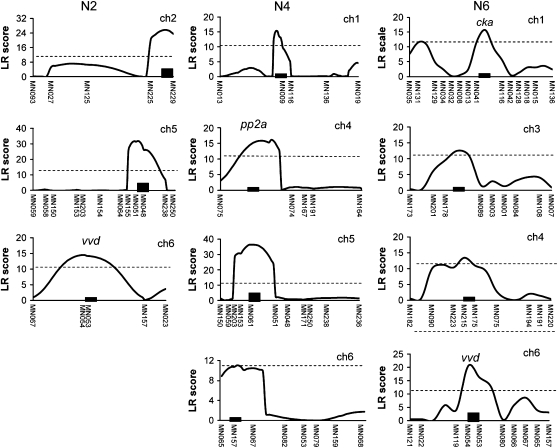
Figure 4.—
Graphical description of composite interval mapping (CIM) analysis in the phase under the 12:12 LD cycle in N2 (A), N4 (B), and N6 (C) populations. The x-axis represents the marker position within the linkage map. The y-axis represents the likelihood ratio (LR) score of each genetic position. The dotted line stands for the threshold level determined by 1000 permutations. QTL names (indicated by arrows with dotted line) and candidate genes in the corresponding QTL are shown around the peak position of the QTL (refer to Table 3).

