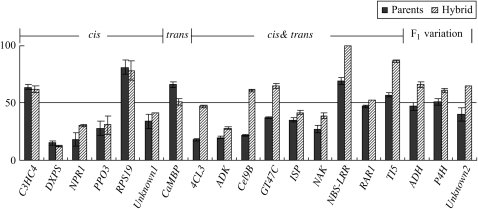
Figure 3.—
Comparisons of the percentages of P. trichocarpa (Pt) transcripts in equal mixes of parental RNAs and in the F1 hybrid. Solid columns and hatched columns represent percentages of Pt transcripts in the mix of parental RNAs and those in the F1 hybrid, respectively. Error bars indicate standard errors of three replicates. Genes are grouped by the regulation patterns. Data are from Table 3.

