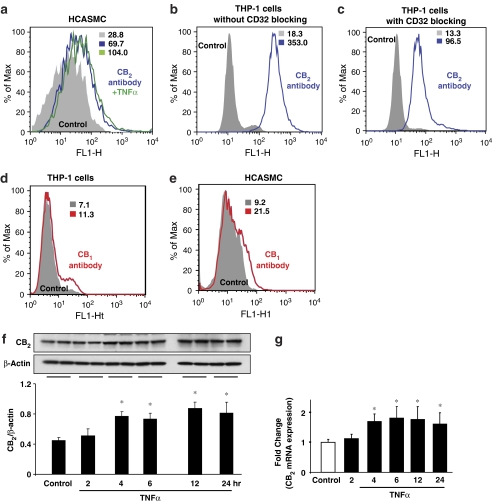
Figure 2.
CB2 receptor expression in HCASMCs and effect of TNF-α. Cells were treated with TNF-α (50 ng ml−1) for 6 h or indicated time intervals and flow cytometry (a–e), western blot (f) or quantitative real-time PCR (g) analyses were performed for CB2 and/or CB1 expression in HCASMCs and THP-1 monocytes, respectively. Panels a–c show surface expression of CB2 receptors in HCASMCs and THP1-monocytes (blue traces) and the effect of TNF-α on CB2 expression in HCASMCs (green trace, panel a). Panels d and e show surface expression of CB1 receptors in HCASMCs and THP1-monocytes (red traces). Panels f and g denote CB2 receptor expression in HCASMCs and the effect of TNF-α by western blot and real-time PCR, respectively. Data presented are representative of 5–7 independent experiments. *P<0.05 vs control.

