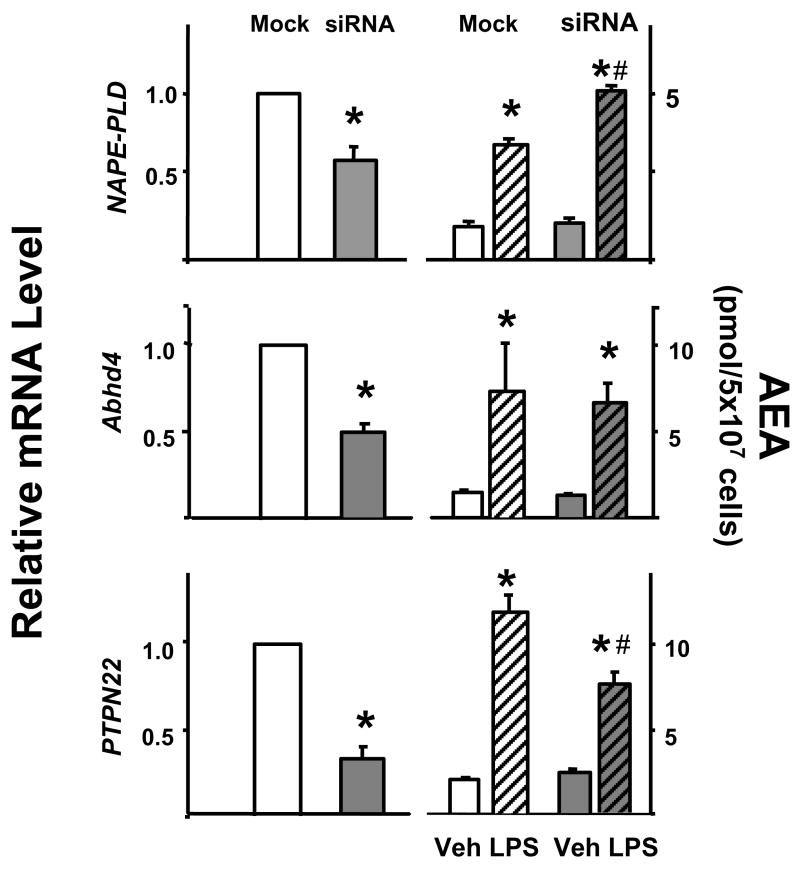
Fig. 2.
The effect of siRNA knockdown of NAPE-PLD, Abhd4 or PTPN22 on LPS-induced AEA synthesis in RAW264.7 cells. The degree of knockdown was verified by real-time PCR in mock-transfected (white columns) vs siRNA-transfected cells (shaded columns, left side). The right two pairs of columns indicate the cellular levels of AEA following vehicle (open columns) or LPS treatment (hatched columns) of mock- or siRNA transfected cells. Means ± SE from three experiments are shown. Significant difference from corresponding vehicle-treated group (*) or from corresponding mock-transfected group (#) is indicated, P < 0.05. Comparison of relative mRNA levels was analyzed by the paired t test, whereas the effect of LPS on cellular AEA levels was analyzed using the unpaired t test.

