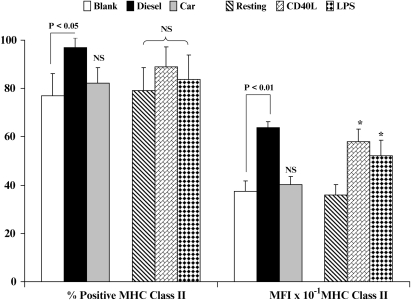
Figure 3.
Flow cytometric quantitation of MHC class II expression. Data on the left show % positive cells, data to the right show geometric mean fluorescence intensity (MFI) ± SD for resting and stimulated DC. Levels of significance between CEP- and DEP-treated DC are shown; *P < 0.05 indicates differences between resting and CD40L- or LPS-treated DC. NS, not statistically significant.

