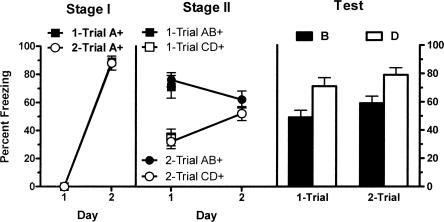
Figure 1.
Mean (±SEM) levels of freezing in Experiment 1. A and C were 30-sec visual conditioned stimuli (CSs); B and D were 30-sec auditory CSs. Freezing developed to A during Stage I (left panel) and to the CD compound during Stage II (middle panel). Performance on testing shows that conditioned fear to B was less than to D (P < 0.05), indicating the presence of blocking. This effect did not differ across groups (P > 0.05). + indicates the presence of footshock with the CS.

