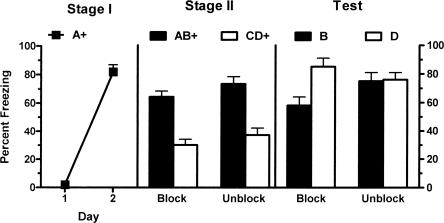
Figure 2.
Mean (±SEM) levels of freezing in Experiment 2. Freezing developed to A during Stage I pairings with a 0.5-mA footshock (left panel). Performance on test shows that animals given a 0.5-mA footshock during Stage II (group block) demonstrate blocking (B < D) while animals that received a 0.8-mA footshock in Stage II (group unblock) fail to show blocking (B = D) (P < 0.05). + indicates the presence of footshock with the CS.

