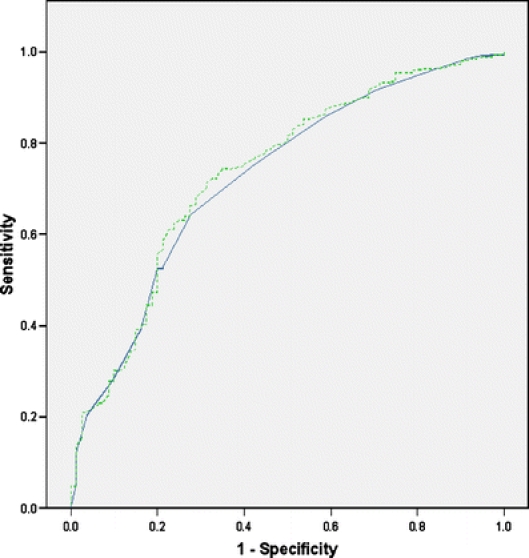
Figure 2.

ROC curves for multivariable logistic regression models predicting intern professionalism ratings. Solid blue line represents the third year GPA; area under ROC curve = .725. Dashed green line represents the third and fourth year GPA; area under ROC curve = .735.
