
Figure 3.
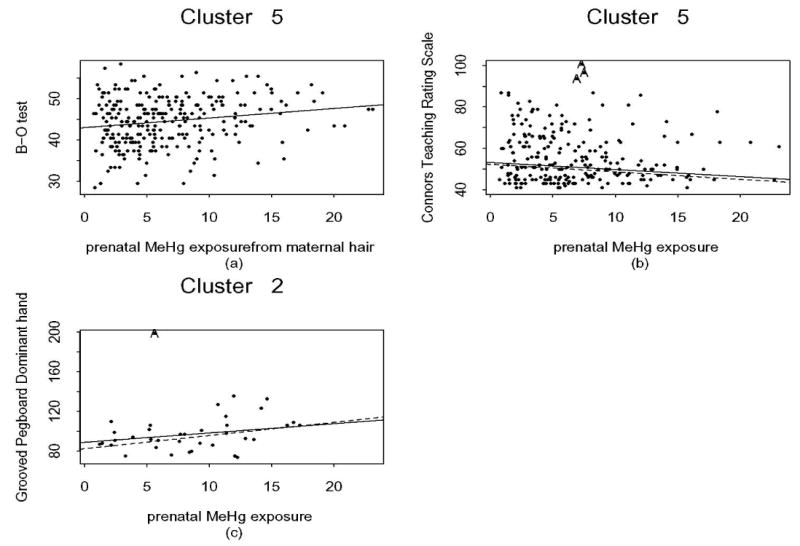
(a) Plot of the B-O test and prenatal MeHg level for cluster 5; (b) Plot of the CTRS and prenatal MeHg level for cluster 5; (c) Plot of the Grooved Pegboard (dominant hand) and prenatal MeHg level for cluster 2. The solid line represents the fitted values of model (2), and the dashed line is the line after removing outliers. The outliers, if they lie within the cluster are denoted by A.