
Fig.1.
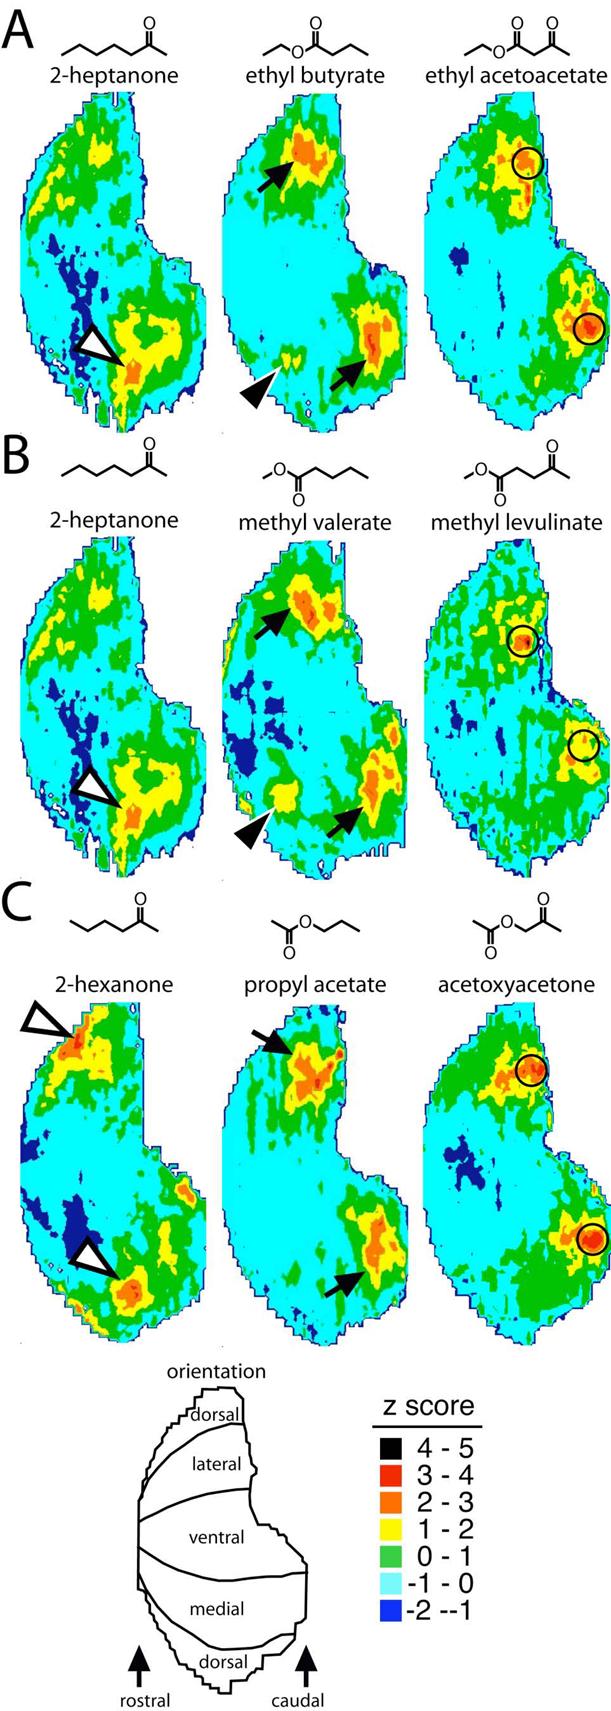
Anatomically standardized contour charts illustrating the distribution of 2DG uptake across the entire glomerular layer in rats exposed to odorants possessing ketone groups, ester groups, or combinations of ketone and ester groups. A: Ethyl acetoacetate and comparator odorants that contain only one functional group. B: Methyl levulinate and comparator odorants. C: Acetoxyacetone and comparator odorants. Each chart represents the average of both bulbs of several rats exposed to the same odorant (Table 1). The charts are in a ventral-centered orientation as shown at bottom left. Warmer colors indicate higher uptake and cooler colors lower uptake in color steps corresponding to the number of standard deviations above or below the mean uptake across the layer as shown at bottom right. Open arrowheads indicate a glomerular module that responds to ketone odorants, black arrowheads indicate glomerular modules responding to methyl and ethyl esters, and black arrows indicate glomerular modules responding to aliphatic esters in general. Circled areas denote posterior regions responding optimally to the odorants possessing both a ketone and an ester group.