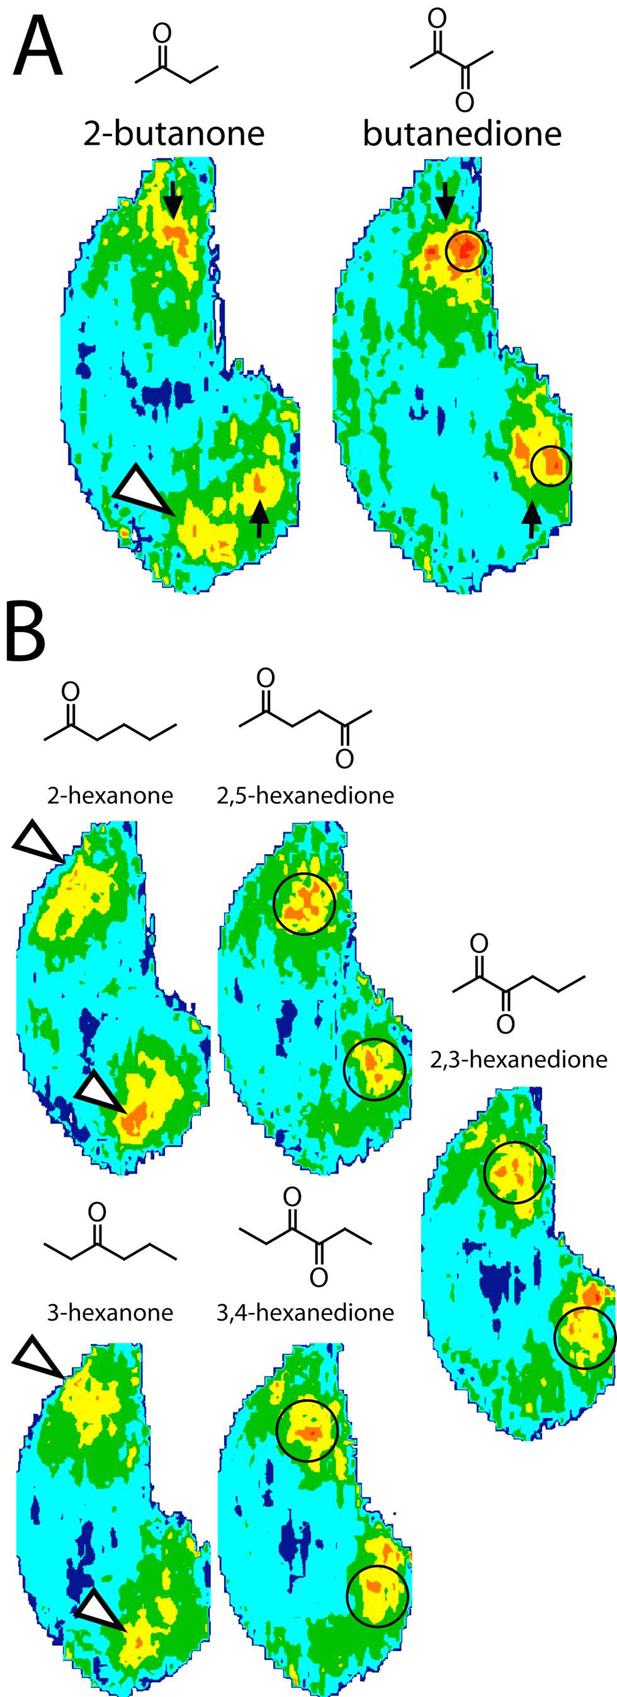
Fig. 2.

Anatomically standardized contour charts illustrating the average distribution of 2DG uptake across the entire glomerular layer in rats exposed to (A) four-carbon or (B) six-carbon ketones or diketones. Orientation and color scale are the same as in Figure 1. Open arrowheads indicate glomerular modules that respond to ketone odorants. Black arrows in A show a region of uptake evoked by 2-butanone for comparison to the more caudal area activated by the corresponding diketone, butanedione (circled). Circled areas in B indicate posterior regions stimulated by six-carbon diketones but not by corresponding odorants with only one ketone group.
