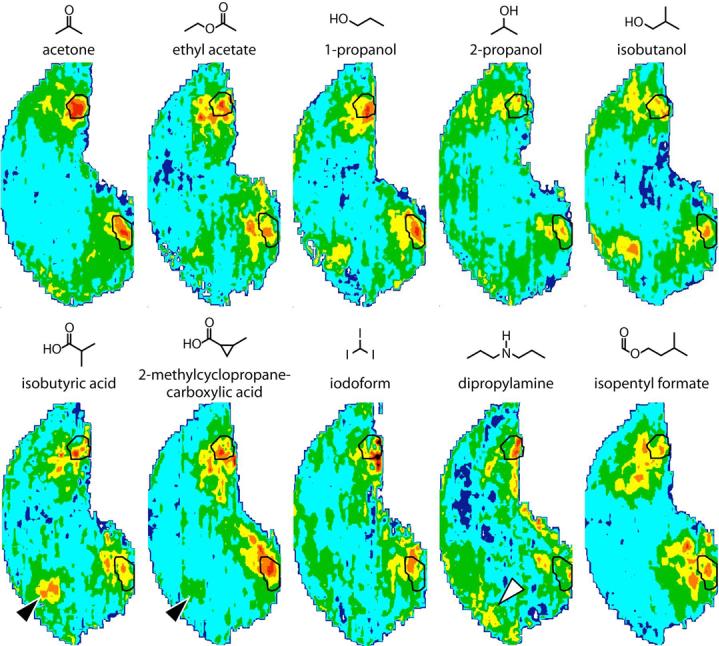
Fig. 7.

Anatomically standardized contour charts illustrating the average distribution of 2DG uptake across the entire glomerular layer in rats exposed to other odorants that stimulate the posterior glomeruli. Orientation and color scale are the same as in Figure 1. The outlined areas represent the boundaries of the modules that were analyzed in Figure 5. Black arrowheads show the location of a module that responds to most carboxylic acids, but that is not activated by the alicyclic odorant, 2-methylcyclopropanecarboxylic acid. The open arrowhead shows a very dorsal region that shows some evidence of being activated by the secondary amine, dipropylamine.
