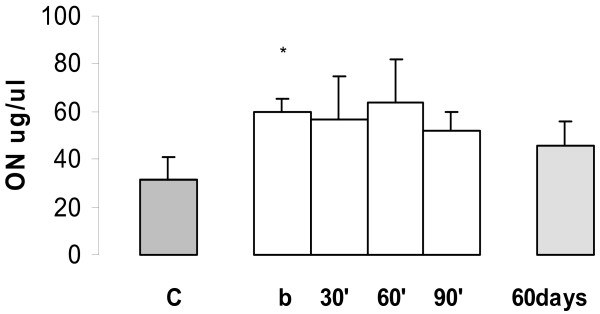
Figure 7.
Expression of NO in plasma in the NMU-induced mammary tumours. Healthy control without tumours (C) versus basal (b) NMU induced rats *P < 0.001 (Values expressed as mean ± SEM). During the time course for NO expression acute and chronic administration of goserelin, between them the differences were not statistically significant.

