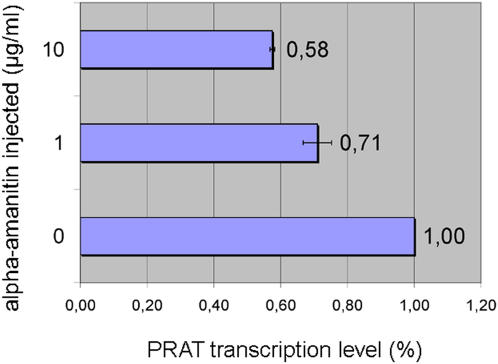
Figure 6. Sensitivity of PRAT transcription to alpha-amanitin.
Results of quantitative real-time PCR analysis are shown. Transcription level of PRAT after injection with two concentrations of inhibitor (1 µg/ml and 10 µg/ml) is compared to the transcription level of PRAT from larvae injected with buffer. 18S rRNA gene was used as endogenous control to normalize PRAT quantities. Error bars represent standard deviations from two different real-time PCR experiments.

