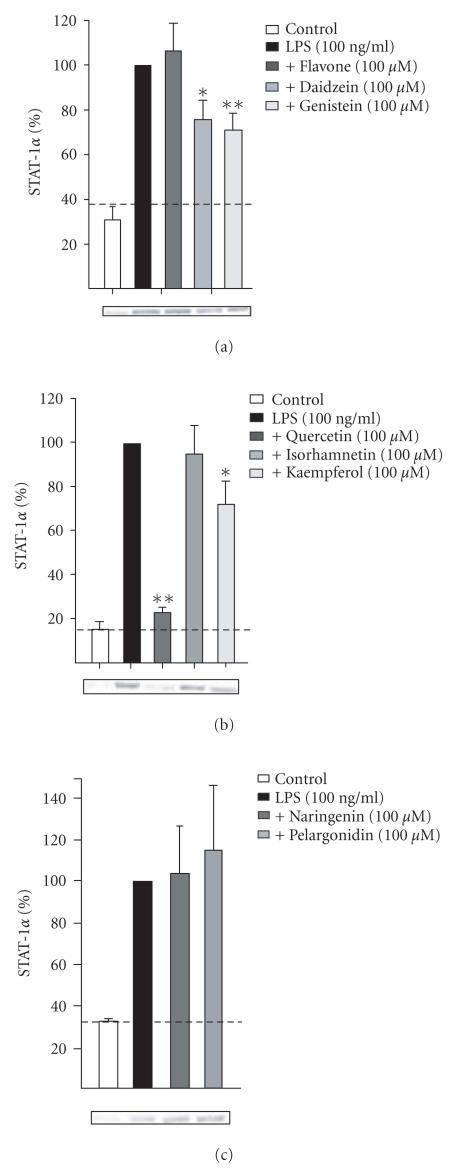
Figure 6.
(a)–(c) Effects of flavonoids on LPS-induced STAT-1 activation determined as nuclear translocation of STAT-1. J774 cells were incubated for 6 hours with LPS (100 ng/ml) or with LPS and the flavonoid (100 μM), and nuclear proteins were extracted. Western blot was used to detect STAT-1 in the nuclear extracts. STAT-1 levels in LPS-treated cells were set at 100% and the other values were related to that. The dotted line represents the nuclear STAT-1 levels in untreated control cells. Mean + SEM, , ** , * as compared to LPS-induced level.

