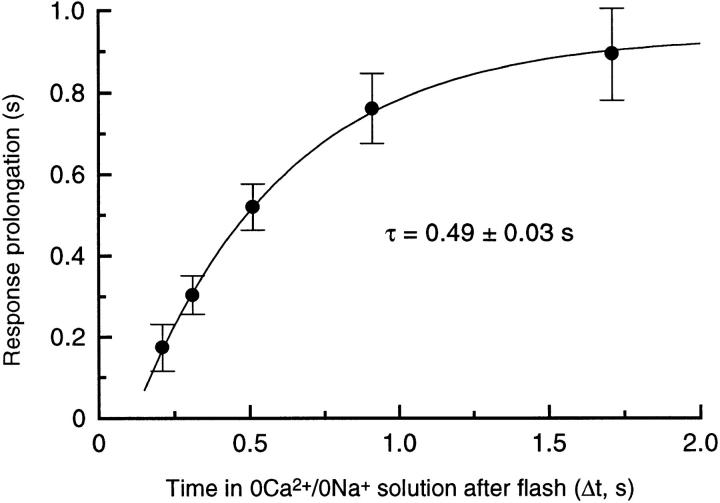
Figure 3.
Collected data from 8 rods for the prolongation of the flash response by exposure to 0 Ca2+/0 Na+ solution as a function of the time spent in 0 Ca2+/0 Na+ solution after the flash, as in Fig. 2. Data represent the mean prolongation (mean ± SEM) of the time for 25% recovery of the original dark current plotted against the interval, Δt, between the flash and the half-relaxation time of the junction current on the return to Ringer solution. Values for Δt differed slightly between cells (total scatter ± 0.01 s), probably due to variation in the precise position of the interface between the two solution streams; mean values are plotted. Solid curve is a single exponential with time constant 0.49 ± 0.03 s offset from passing through the origin by 0.11 s, fitted using a weighted least squares algorithm. Bright flashes delivered 5,350 photons μm−2.

