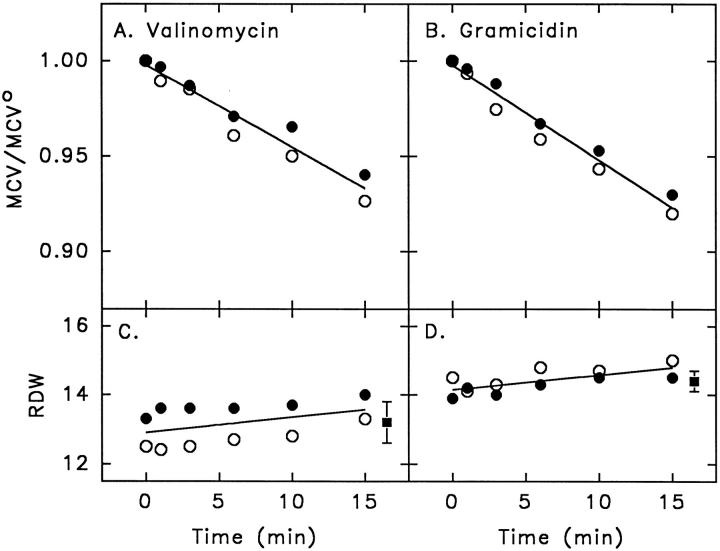
Figure 2.
(A and B) Decrease of mean cell volume, MCV, relative to initial mean cell volume, MCVo, induced by addition of 1 μM valinomycin (A) or 60 ng/ml gramicidin (B). Washed human red blood cells at 1.2 percent hematocrit were pretreated with 10 μM DIDS for 30 min at 23°C in medium containing 1 mM KCl and 149 mM NaCl (for valinomycin), or 1 mM KCl and 149 mM choline chloride (for gramicidin); after addition of ionophore, the mean cell volumes were measured at the times indicated (see materials and methods). Points represent average values of samples from duplicate flasks; the filled and empty symbols refer to two experiments, and the solid lines are linear regressions. (C and D) Time course of the relative distribution width (RDW) or coefficient of variation of the Gaussian distributions of cell volume, determined for each sample in the experiments in A and B after addition of valinomycin (C) or gramicidin (D). Filled squares represent mean ± SD (n = 12) for all of the points in the respective time course.

