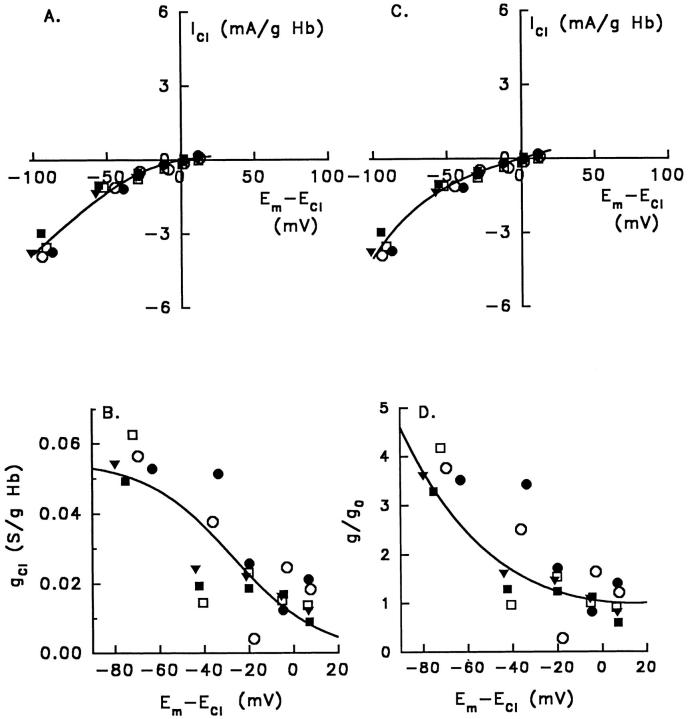
Figure 5.
Current-voltage curves (A and C) and conductance-voltage curves (B and D) for five experiments (represented by different symbols) with human red blood cells treated with 10 μM DIDS (pH 7.5, 23°C), determined as described in materials and methods. Solid lines represent best fits of the voltage-gated mechanism of transport (A and B) and the single barrier model (C and D) to the same set of experiments. The five experiments (each with six different concentrations of [K+]o) were as follows: two experiments with 1 μM valinomycin (filled circles and squares); one experiment with 3 μM valinomycin (filled triangles), and two experiments with 60 ng/ml gramicidin in choline medium (hollow circles and squares). Each data point in B and D represents the slope conductance between adjacent data points in A from the same experiment, and is plotted at the midpoint of the voltage for each pair of data points. The solid lines in C and D represent best fits of the single barrier model to the data, according to Eq. 5 for C and Eq. 7 for D (see text), with γ = 0.43 ± 0.02. The solid lines in A and B represent best fits of the voltage-gated mechanism of transport, according to Eq. 14 for A and Eq. 12 for B (see text). For this mechanism, the maximal conductance, g max = 0.055 ± 0.005 S/g Hb (SD, n = 5), was taken from the measured slopes between −50 and −100 mV, corresponding to 10 and 1 mM [K+]o, in each experiment. From the curve fits, the voltage Eo giving half-maximal conductance is −27 ± 2 mV, and the equivalent gating charge zG is −1.2 ± 0.3.

