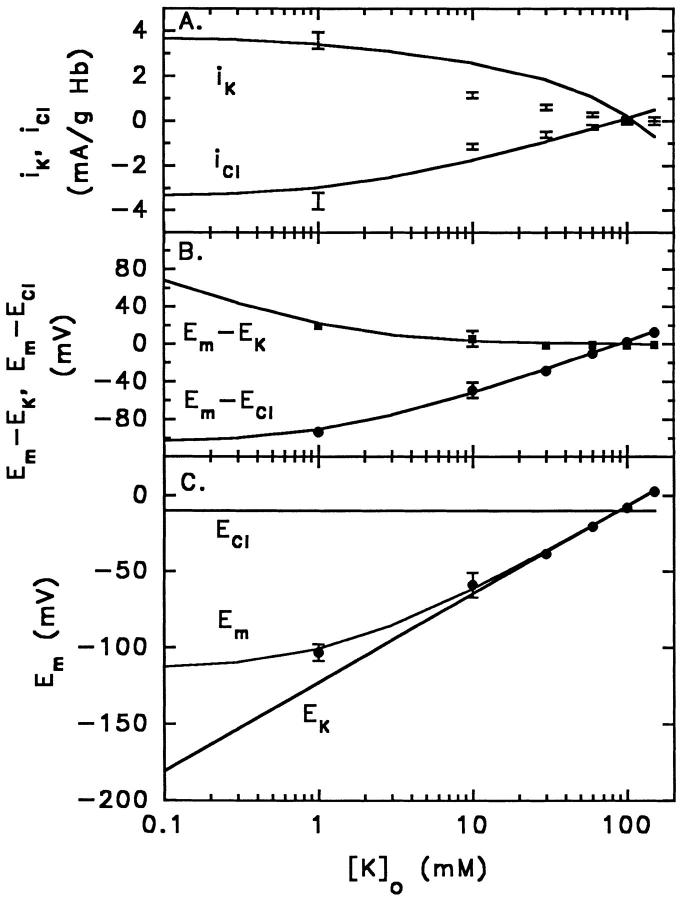
Figure 6.
Comparison of measured currents and voltages with predictions of the theory of electrodiffusion, as applied to human red blood cells at varied [K+]o, first treated with 10 μM DIDS, and then with valinomycin or gramicidin (in sodium-free medium). Data points represent the means ± 1 SD of the measured values at each [K+]o of (A) iK and iCl, (B) E m − E K and E m − E Cl, and (C) Em itself from the same five experiments shown in Fig. 5. (A) Ionic currents iK (upper line is the best-fit according to Eq. 3) and iCl (lower line is the best-fit according to Eq. 4). From Eq. 4 for iCl and the measured values of Em (Fig. 6 C), the best-fit value of PCl is 3.7 ± 0.4 (10−5) s−1, or 0.13 h−1; using α = P K/P Cl = 74 (Fig. 6 C), the value of PK is 2.7 (10−3) s−1, or 9.7 h−1. (B) Driving forces Em − EK (upper line) and Em − ECl (lower line), taking Em from Fig. 6 C, EK from the measured cell K+ (Table I), and ECl from the measured Donnan ratio for Cl− (Table I). (C) Membrane potential Em (middle line) in relation to EK (lower line) and ECl (upper line); from Eq. 1, the best-fit value of PK/PCl is 74 ± 9. Calculations (solid lines) used [K+]c = 130 mM, E Cl = −10 mV with [Cl −]c = 101 mM and [Cl −]o = 150 mM corresponding to r Cl = 0.67 (from Table I).

