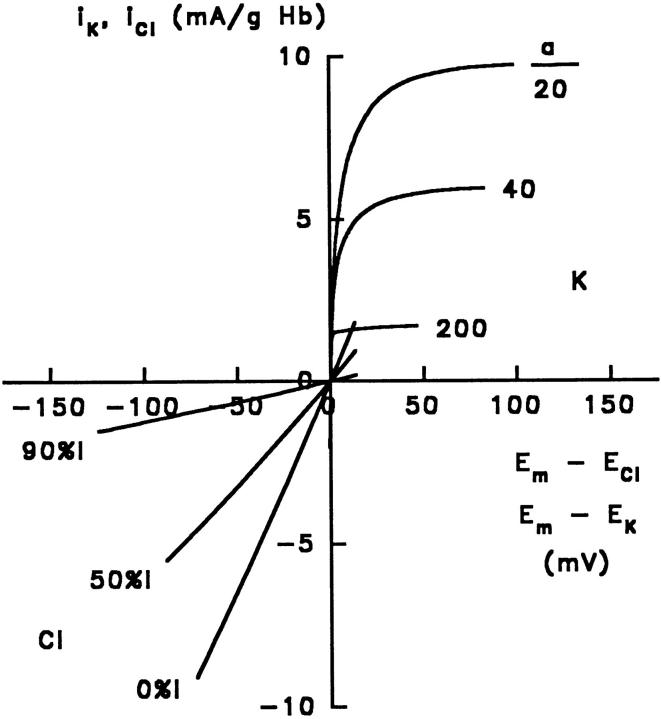
Figure 7.
Predicted current-voltage curves, according to the theory of electrodiffusion, with 0%, 50%, and 90% inhibition by DIDS, corresponding to P K/P Cl = 20, 40, and 200, respectively. The upper right quadrant shows the predicted potassium currents, iK, plotted vs E m − E K, calculated as for the upper lines in Fig. 6, A and B; the lower left quadrant shows the predicted chloride currents, iCl, calculated as for the lower lines in Fig. 6, A and B.

