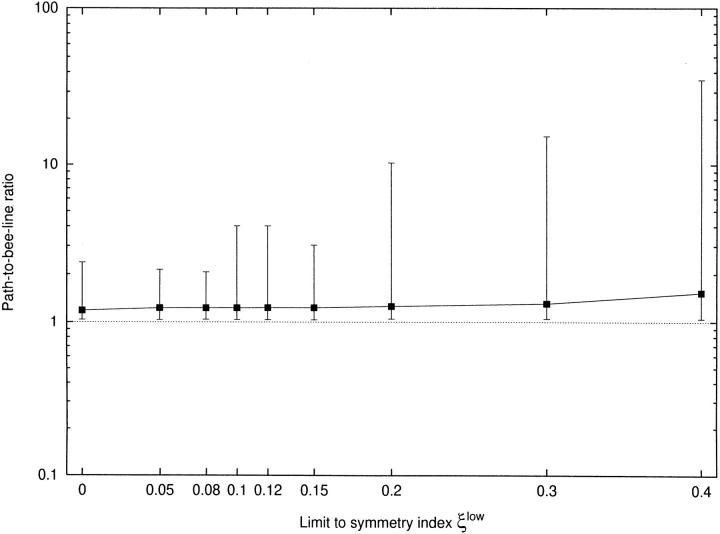
Figure 4.
Path-to-bee-line ratio for limited asymmetry. x-axis: limit to symmetry index (ξlow). y-axis: path-to-bee-line ratio as defined in Eq. 7. For each tree the paths to all terminal segments are examined; squares indicate mean values, bars show minima/maxima. Note that this figure also displays the results for additional CCO-trees with ξlow = 0.05, 0.08, 0.12, 0.14, and 0.2.

