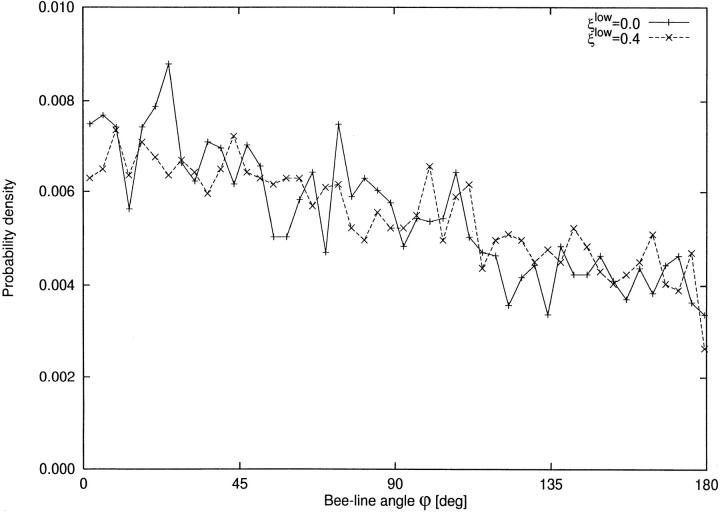
Figure 5.
Segment direction relative to the bee line. x-axis: angle between bee-line and segment orientation, ϕ[deg]. y-axis: probability density [deg−1]. ϕ is computed via the scalar product. 0 deg indicates parallel orientation, 180 deg parallel-opposed orientation. (solid line) tree with ξlow = 0; (dashed line) tree with ξlow = 0.4.

