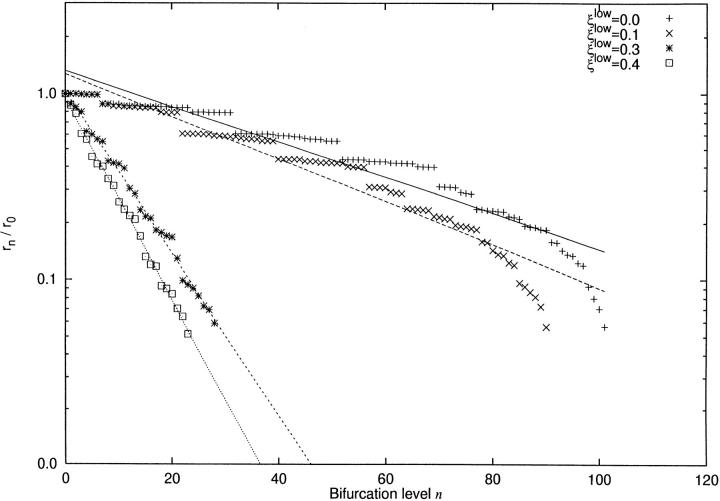
Figure 7.
Branching rate for “main path” in CCO model. x-axis: bifurcation level n. y-axis: rn /r 0. For symbols see figure legend. For each ξlow a separate linear regression for log(rn/r 0) over n has been performed according to least squares. The branching rates, computed from the regression coefficients and characterizing the shrinkage of segment radius are given in Table II, compare also Eq. 11.

