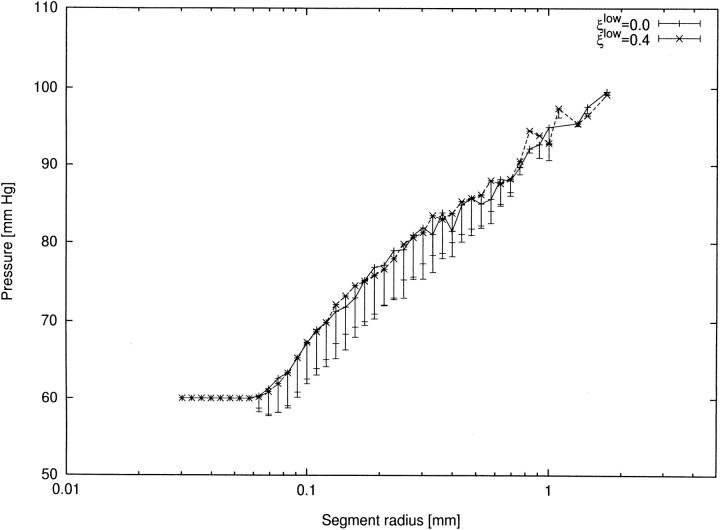
Figure 9.
Insensitivity of pressure profiles to the limit to asymmetry. x-axis: segment radius (mm). y-axis: pressure (mm Hg) at distal end of segment. Symbols denote mean values and bars standard deviations. (solid line) tree without a limit on asymmetry (Fig. 2 A); (dashed line) tree with ξlow = 0.4 (tree shown in Fig. 2 D).

