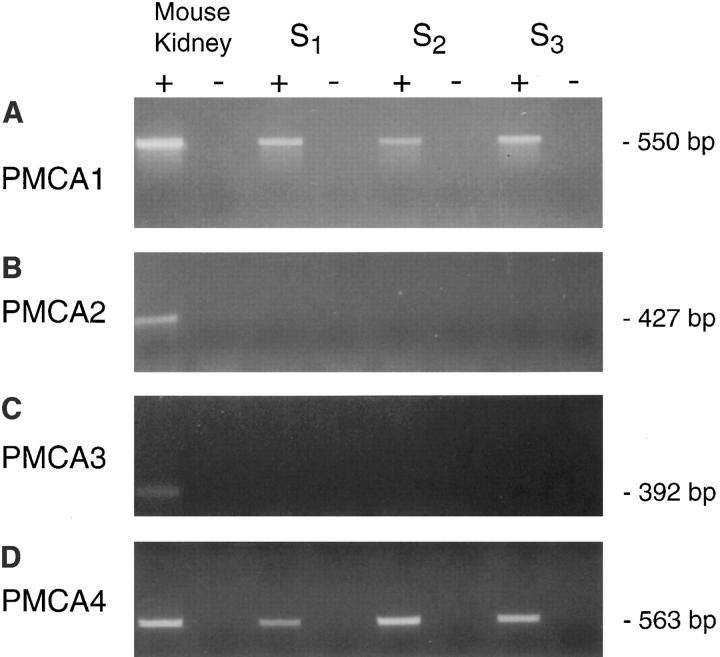
Figure 1.
Analysis of PMCA expression by RT-PCR in S1, S2, and S3 proximal tubule cells. RT-PCR was used to amplify specifically transcripts encoding each known PMCA isoform. For all PMCA primer sets, the + sign designates samples analyzed in the presence of reverse transcriptase; – indicates samples analyzed in the absence of RT. Product size is shown on the right. Appropriately sized products were amplified from mouse kidney RNA in the presence of RT by all primer sets and RNA analyzed in the absence of RT showed no products. Only products consistent with PMCA1 and PMCA4 were amplified from proximal tubule cells. Primer sequences are listed in Table I.

