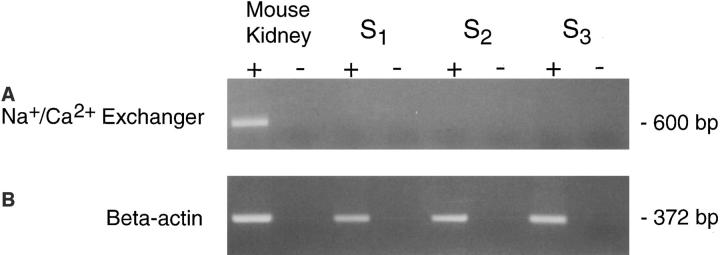
Figure 4.
Analysis of Na+/Ca2+ exchanger transcripts in proximal tubule cells. RT-PCR was used to assess exchanger transcript expression in proximal tubule cells as described in the text. The products were visualized on an ethidium bromide– stained agarose gel. (A)lane 1, mouse kidney mRNA; (+RT); lane 2, mouse kidney mRNA (−RT); lane 3, S1 RNA (+RT); lane 4, S1 RNA (−RT); lane 5, S2 RNA (−RT); lane 6, S2 RNA (−RT); lane 7, S3 RNA (+RT); lane 8, S3 RNA (−RT). Only mouse kidney displays a product of the appropriate size, 600 bp, whereas the proximal tubule cell lines are negative. (B) β-actin RT-PCR performed on the same samples used for analysis of exchanger expression. All samples yielded a product of the appropriate size, 372 bp, indicating that the RNA was intact.

