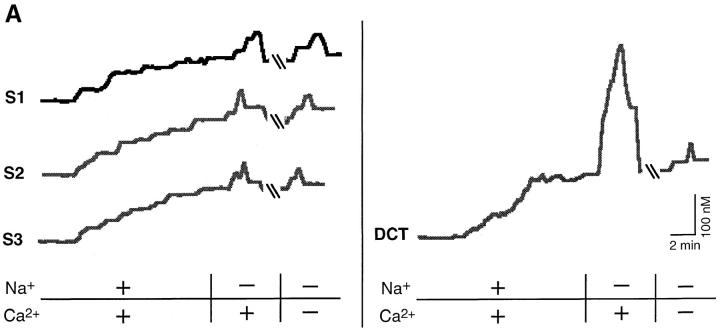
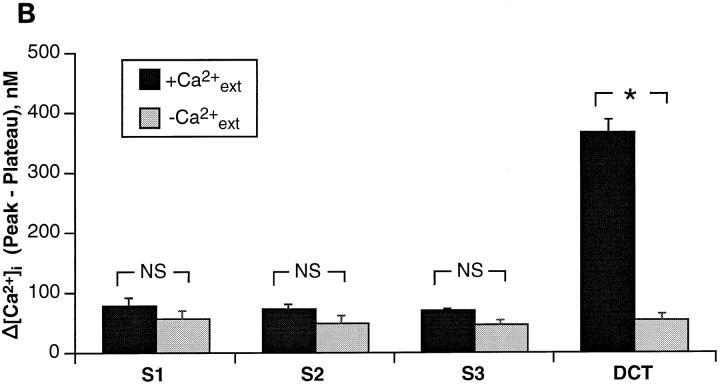
Figure 6.
Analysis of Na+/Ca2+ exchange in single S1, S2, and S3 cells. To assess Na+/Ca2+ exchange activity, proximal tubule cells were loaded with the Ca2+-sensitive dye fura-2 and single cells were assayed by measuring [Ca2+]i upon reversal of the electrochemical gradient for Na+ by isosmotic replacement of extracellular Na+ in the presence or absence of external Ca2+ in paired analysis on the same cell. DCT cells served as the positive controls. (A) Representative traces are shown for each cell type analyzed. Slash marks in the traces indicate a ten minute wash with control buffer. All proximal cells showed similar rises of [Ca2+]i in the presence and absence of external Ca2+. However, the DCT cell exhibited a large rise of [Ca2+]i in the presence of external Ca2+ but only a minimal rise in the absence of external Ca2+. (B) The difference between the peak and plateau [Ca2+]i in the presence or absence of external Ca2+ was not significantly different for all proximal lines. In contrast, the control DCT cell showed a large rise of [Ca2+]i in the presence of external Ca2+, and a rise similar to that of proximal cells in the absence of external Ca2+ (P < 0.01). Each bar represents the mean ± SEM of three independent experiments performed on each cell type.


